Home
Isroel Kogan
https://www.linkedin.com/in/isroel-kogan/
PROJECTS
READING

- Webpage: https://mta2014.isroelkogan.com/mta2014/map_mta
- Github Repo: https://github.com/ImKogan/MTA2014
Overview
Please check the README for a in-depth overview of the project and some relevant technical details.
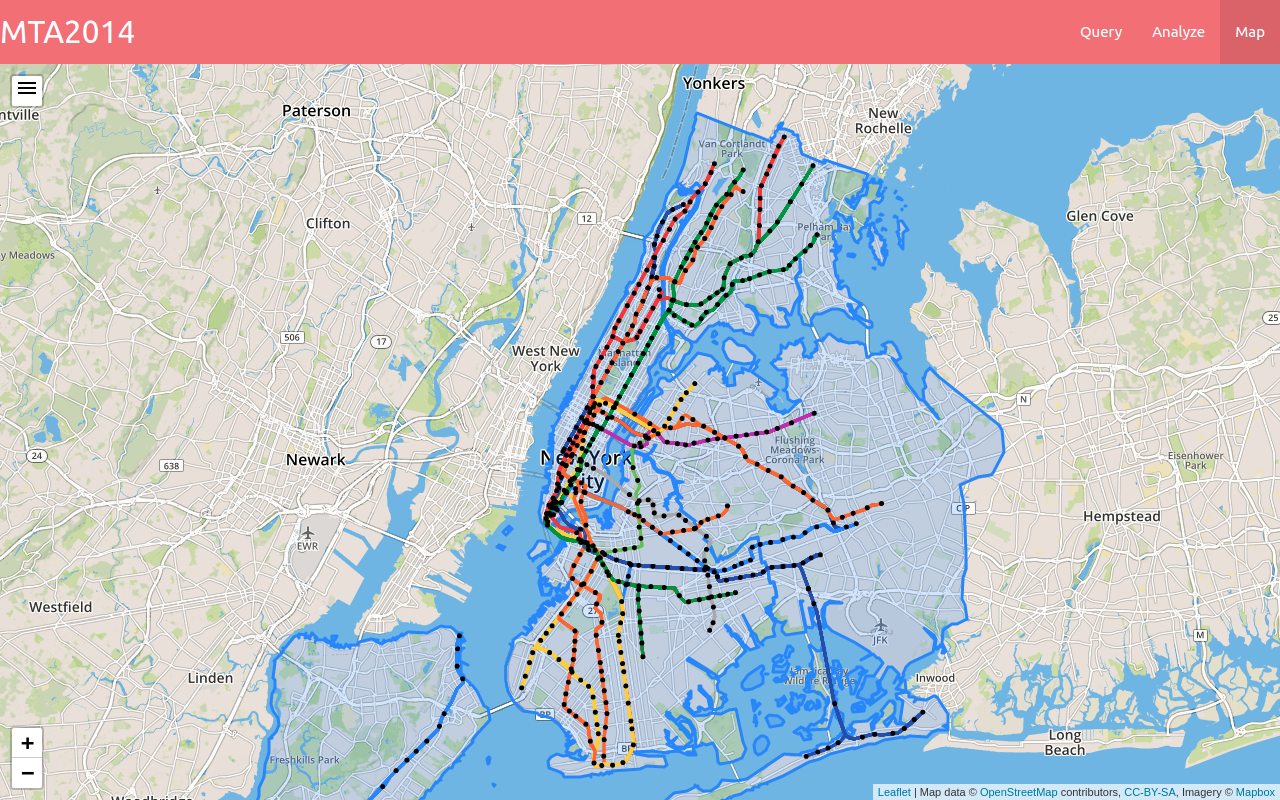
mta2014 has 3 related (but self-contained) uses:- Visualization: A interface that superimposes the subway system on a map of NYC. Subway arrival times can be visualized by route or by stop.
- Querying: All the data is queryable and downloadable as a csv file. This can be of great value to any others looking to analyze this data, as its source version is in a very unfriendly format (for analysis).
- Analysis: Analysis showing various peformance metrics, allowing comparisom with the MTA's own published performance metrics http://dashboard.mta.info - as well as original insights. This has yet to be developed.
Currently the application allows for visualizing and querying historical (2014) Subway trip data based on the MTA's historical archive. Historical data instead of current live data is used as a means to build a prototype on static data before rolling out a live version.
Motivation
For those who use the NYC subway on a daily basis, it is hard not to wonder how a city as wealthy and prosperous as NYC can not solve its public transportation problems. When compared to many other cities around the world, the contrast is even starker, and not in favor of NYC. As NYC Subway usage has reached new peaks this decade (see here), the state of the Subway has become a focal point. My initial motivation for this project stemmed from reading performance statistics published by the MTA http://dashboard.mta.info/ and local news sources. I wanted to know how some of these metrics are determined. This project is an attempt to answer these questions.
As it turned out, live data for the MTA (and for transit systems in general) - follows a protocol called GTFS Realtime. While this specification is very useful for providing realtime updates (such as on https://new.mta.info/ and on station platforms), it is not easily convertable to a tabular format (such as a csv) for analysis. The feed, which is updated every 15 seconds, consists of several components and extracting deduplicated but complete data was non-trivial.
This necessitaed building an ETL pipeline that extracts the original feed and loads transformed data into a PostgreSQL database. Along the way, I decided to expand the project to include a visualization tool, as well as allowing others to query the database directly. I believe the latter utility could be quite valuable to researchers, allowing them to use the data in a familiar ready-to-use format.
Why is it called MTA2014?
When the project was first conceived, the mta developer portal only provided historical data for a few months (and only some subway lines) in 2014. Later I decided to continue using static data in order to build the core of the application before building a live data pipeline.
Component Diagram
A top level sketch of the project shows two main coponents: An ETL pipeline that feeds a PostGIS Database, and a Django app that serves data to the web page.
For a deeper dive into the code and the tools used, please check ou the projects repo. See the README for instructions on how to reproduce the entire project in a VM via a Vagrant script.
Current state and next steps
As noted above, the application allows for visualization and querying of all the historical trip Subway data from 2014. The analysis tool would complete the prottype stage. Some additional work is needed (augmenting the DB with more static data) to allow for comprehensive analysis.
If the app is to have any meaningful use, the pipeline and application needs to be replicated for current live data. Once this is accomplished, the application can have several uses: